Day two of the Dembo assignment is a fun one. As a relatively nascent blogger, gathering data on the traffic to and from my blog has been enlightening. That data is what this post is all about.
I started this blog in April. On August 22nd or so, I added the code for Google Analytics to this site, the tech PD site for my school, and my marine biology site. I have to say tracking the who, what, when and where of the visitors to my sites has been intriguing. It is almost addictive. I agree with Steve when he says, “…those graphs are good for the ego and can be highly motivating. For example, the days when I do post a new blog, I clearly see a bump in traffic, which is always incentive to post more often!”

Not only is proof that people really are connecting to your words validating, it is a fantastic teaching point. Since all of my students are now dipping their toes into the blogosphere, at least on our network sites, I periodically try to highlight interesting stats for them on the big screen. What would be the main point here? Connectedness. One of the main reasons for participating in blogging is the building of collective intelligence. This is the key element of Web 2.0. This is why the read/write web has and is changing the face of communication and of education in bright little pockets all over the globe. For people generally unfamiliar with blogs- these connections make an impact. I spoke of this briefly in an earlier post on blogging.
Writing and sharing to a wide audience is huge. A few colleagues and I are about to embark on an action research project to examine the effects of writing online compared to merely hitting “print” and walking your words to your teacher. In recent discussions, we have talked in depth about the differences we see in our student work when interacting online. We think we see increased volume, engagement, creativity and even a stronger “tuning in” to the elements of our specific content. Therefore, we are going to attempt a study to examine these effects across several disciplines. If nothing else, we will certainly be better able to characterize what is going on with our students as we move more of what we do onto the transparency of the web.
So, on to the “assignment” at hand. This one was easy for me, since I realized the value of this far before I actually added analytic capability to my site. However, reading the assignment today reminded me of a few of the stats I had forgotten to check for some time.
I took several screenshots within my analytics page and posted them to my Flickr account. I will post a few of them inline now, but the rest can be viewed here. As a scientist by training, trust this: this much data tends to make me a bit giddy. Wow. To start, a 30,000ft view of the traffic pattern to my blog:
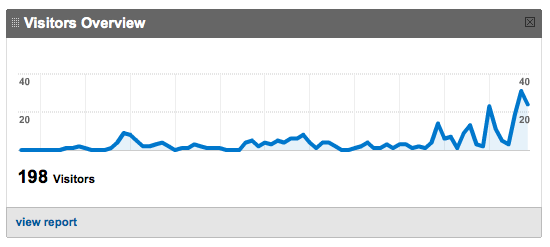
As you can see here, when you start any blog, the traffic is quite light. It is also quite clear to see the bumps I get each time log a new post now. The really cool thing to me is that the trend shows that there are consistently more people reading those posts as time goes on. This is a good sign that I’m not making folks too terribly upset. Or perhaps… I am. Interesting thought. It is cool to think of 198 absolute unique visitors in just the past couple of months. That is encouraging to any blogger and is certainly an impetus to keep on posting.
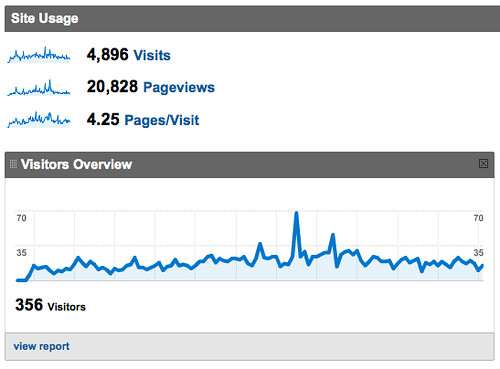
The chart above was clipped from the tech cohort blog I set up called Virtual Soutside. This provides a look at the difference when you have twenty people contributing to a site. Also, instead of a mere three months of visits, I have been tracking this site since June of 2008.
Other assorted facts gleaned from the analysis of this blog to date include:
- Over 60% of the traffic here now comes from referring sites. These are essentially, other sites that link to my blog. Some of these are controlled by me, such as posting a link to my Twitter peeps. Some are controlled by folks posting an outbound link to nashworld on their site.
- My readers are from eleven different countries. (14 as of the next morning) The vast majority are from the United States, but others are from Malaysia, Kenya and India to name a few.
- 65% of my visitors view this site through the Firefox browser. That happens to be my personal browser of choice about 90% of the time as well. There are times when I fire up Safari as well. They really do perform differently at times. Only 19% view nashworld via Internet Explorer. This make me strangely happy.
- 63% of you come to my blog powered by the Mac operating system. Wow. That is far more than I expected, even with our heavy usage of OSX in the district. Almost 3% of visitors now arrive here in the palm of their hand via iPhone, and one person actually found their way here from a Playstation 3.
- The average visitor views 2.6 pages here. This surprised me as well. I thought that number would be far smaller. The way I have the blog set up now, a visitor arriving via the main page can actually read ten separate posts without even clicking another link. This is also encouraging to me.
- Speaking well to the power of smart referrals, the average time spent on any given visit is far higher when you come from a link posted by another blogger. The really crazy stat is that the average time spent on the site by visitors arriving from Will Richardson’s blog, Weblogg-ed, is far higher than the rest. Those of you coming in from Weblogg-ed currently spend an average of nearly 15 minutes on the site as opposed to the four and a half minutes of all visitors. Hey Will, your readers have taste!
- This is but a slice of the data available from Google Analytics. Even my Flickr set, with all of the screenshots I just referenced and a few more, is barely a fourth of what the site can reveal.
- Also interesting is the visitor visualization on ClustrMaps. You can see this map over in the right sidebar of this page=> I just added this Widget to the blog abut a month ago. I don’t think it is as accurate as GA, and it is definitely not as comprehensive, but it sure is pretty, and gives your readers a slice of your data at a glance.
So to sum things up, I am two assignments down and 28 to go. I have a feeling that things will get rocky toward the end when our new little girlie is born, so I am buckling down for the near term. Also: I don’t know all of my readers, but I like them. They tend to be super-connected Mac snobs who read some other really smart blogs. They can also probably tell me some amazing things about these stats I haven’t yet noticed. By all means, please do respond with what you see in this data.
If you are local and would like some help setting up Google Analytics for your blog, you know who to ask. Right?
Artwork thanks:
Warby, William. “Traffic Light Tree.” warby’s photostream. 03 MAY 2008. Flickr.
2 Nov 2008 <http://farm3.static.flickr.com/2077/2460655511_779a1d1a5c.jpg?v=0>.
![Reblog this post [with Zemanta]](http://img.zemanta.com/reblog_e.png?x-id=bb3e5a82-ede0-4e4a-b732-6403098300ad)
Wow. That’s some seriously impressive crunching of the numbers. That’s really incredible how much you learned about your visitors. Makes me think that I need to spend more time in Google Analytics. Clearly I’m only scratching the surface in my usage of it.
The great thing is… I am a terrible cRUnCheR of numbers. What I do value, however, is the analysis and inference and I can do after GA does the crunching!
And to think, I thought all I’d discover from Google Analytics was how many and from where. I get giddy thinking of the possibilities.
And, going to your Action Research Project, I find it timely as our esteemed local paper gave front page to discussing how social networking and Google have reduced the rigor of reading and writing.
I so disagree, and am interested in your comments.
Thanks for using (and mentioning) ClustrMaps! You’re right that we’re all about the ‘quick gestalt’ and showing off your users, rather than about the fine-grained statistics of the wonderful Google Analytics. Our dots are accurate, and we take pride in showing ‘impossibly many dots in an impossibly small space, impossibly fast’.
Another key differentiator from the other tools is typified by THIS posting – we are fanatical about our loyal users, and beam in to thousands of blogs around the world to keep up with their comments!
Anyway, thanks for sticking with us… come to think of it, while I’m in such a positive mood, I’ve just given you a free upgrade to ClustrMaps+ (better continent-level maps, no ads), which will take effect after the next overnight update.
Enjoy!
@ClustrMaps Team – Wow. How cool. Thanks much for the upgrade. The continent zoom feature on the + version is really great.
The reason I mentioned “accuracy” was the simple fact that I was noticing how GA would record a hit from South Korea… and it didn’t show here for days. That happened a few times, and what I didn’t realize is that it was a simple issue with refresh rate. GA is almost immediate, and ClusterMaps shows up a little bit later.
However, GA certainly doesn’t look so amazing in the sidebar of a blog. Very sweet little widget. Thanks again!
ClustrMaps Team – Wow. How cool. Thanks much for the upgrade. The continent zoom feature on the + version is really great.
The reason I mentioned “accuracy” was the simple fact that I was noticing how GA would record a hit from South Korea… and it didn’t show here for days. That happened a few times, and what I didn’t realize is that it was a simple issue with refresh rate. GA is almost immediate, and ClusterMaps shows up a little bit later.
However, GA certainly doesn’t look so amazing in the sidebar of a blog. Very sweet little widget. Thanks again
Nashworld great is an impressive number of crunching. It is really incredible that how much you learn from your visitor. And after using this in my business I thought that was all I can get from Google Analytics.
Nashworld that’s some seriously impressive crunching of the numbers. It is really incredible how much you learn from your visitor. I use this in my online business which is CBD Products and I got better results.
Nashworld that’s some seriously impressive crunching of the numbers. It is really incredible how much you learn from your visitor. I use this in my Web Development Company and I got desired results.
Its been really nice blog to read on and I really learn your this blog post. As I am regular visitor of your site and I am quite used to adopt so many positive from your experience and implement on my web which is Brave Count site on based on minerals information
Yes indeed I totally agree with you being a content writer at Cycjet Coder I personally noticed that the content of this author is really high authority and a meaning full.
Nashworld that’s some seriously impressive crunching of the numbers. It is really incredible how much you learn from your visitor. I use this in TOB BUY and I got desired results.
Yes absolutely I definitely agree with you being a data analyst at Wintfloors. And in my opinion seen that the content material of this writer is certainly excessive authority and a which means full.
I was a little skeptical when I first used Nashworld, but it is so easy to use! Now I have learned so many new things about my business Orlando Transportation services website traffic and even conversion rates. The support team has been great too and I have already recommended this tool to a few people.
Excellent!! Who are you? Your brilliance astonishes me. Teething Tubes, reveal your genesis, and enlighten us about your path to such remarkable intelligence. A captivating enigma.
Amazing information. I really enjoyed reading this thread and discussion by the people. As someone who is involved in this “kids clothing” for many years, I would like to refer Ochre Clothing. It’s not only focused on discussing the topic inside out but also “Benefits”. Hope everybody enjoys reading the blog.